Clean Console
I’ve been fortunate to instruct and work with many people that are beginning to code through the very same bootcamp I attended about a year and a half ago (Thinkful — yes this is a shameless plug 😜 ). Most recently I’ve been doing a series of workshops on Chrome Devtools, where I teach common parts of Chrome DevTools that many front end developers are using daily. One of the most common inefficiencies I’ve noticed is using console.log to preview JSON responses from an API.
I didn't learn how to use Chrome DevTools until I got on my first gig. I knew how to do the basics — preview CSS changes, change HTML, basically a bit of the stuff inside the Elements tab.
I've also heard similar stories from some of my colleagues at my current job — debugging & developer tools aren't usually learned until after people get out on their first gig. One reason is that 3–6 months is a short time to learn how to program, much less learn how to use developer tools well (but I digress…maybe that’s another blog post).
My most recent workshop focused on the Chrome DevTools "Network" tab: how to analyze your load time & other "productivity hacks" I've picked up.
The Problem: Log, Log, Everywhere
One of the earlier lessons in the process of learning web development is learning about fetching data via AJAX. Most apps that goes beyond triviality or need to respond to data dynamically are gonna fetch some JSON from an API, and then operate on that JSON.
Many times, I would find myself doing something like this in my source code so that I could preview the JSON response.
fetch('https://jsonplaceholder.typicode.com/posts')
	.then((res) => res.json())
	.then((json) => {
		console.log(json); // to see what the response was
		// code operate on the JSON goes here
	});
To preview my JSON, I would either scatter console.log all over my codebase and dig through the browser console window to find my JSON, or I would copy-paste the endpoint into Postman or a cURL request. All of these work, but what if there was a faster way to debug JSON responses in the browser?
Chrome DevTools To the Rescue!
Thanks to Chrome DevTools, we can preview our JSON without touching our source code (read: higher productivity & a smaller chance that you accidentally forget to delete a console.log).
1. Open the Network Tab
I’m going to demonstrate all of this on one of my own apps, called Horizon. It's essentially a sunset tracker, pulling data from https://sunrise-sunset.org/. You're welcome to follow along or use any app of your choice, provided it sends JSON over the internet.
First, since we're gonna be debugging via the Network Tab, we'll want to open that up. Once you've got it open, you'll see something like this.
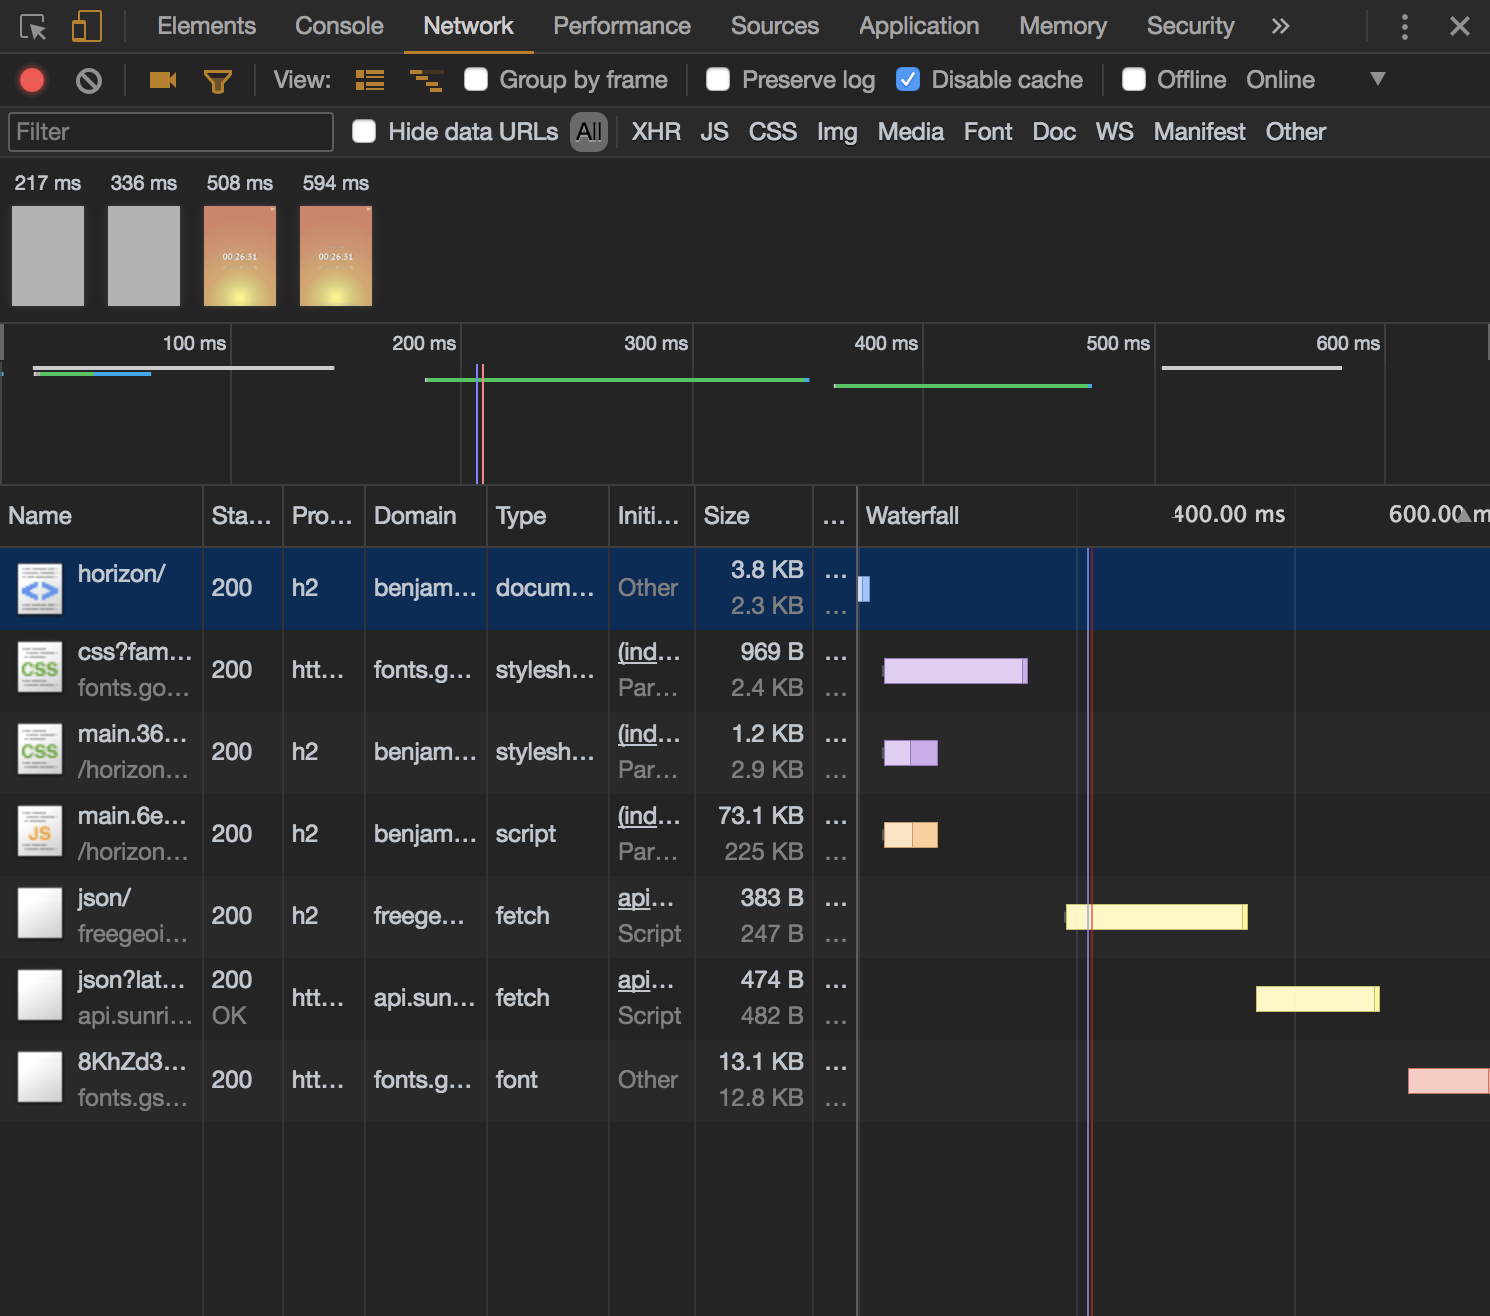
Great! Now we're all set to start our debugging.
2. Filter by XHR
While my sample app may not have a ton of requests, many apps can contain 100+ requests on initial page load, making it a little more difficult to find the specific AJAX request we're looking for.
Fortunately, Chrome DevTools lets us filter by response type. You'll see all of the options available to you near the top bar. Select XHR (this stands for XmlHttpRequest), which contains all JSON data pulled into the app via fetch (or $.ajax, axios, or whatever way you're using to grab your data).
With the response filtered, your Network Tab should look like this:
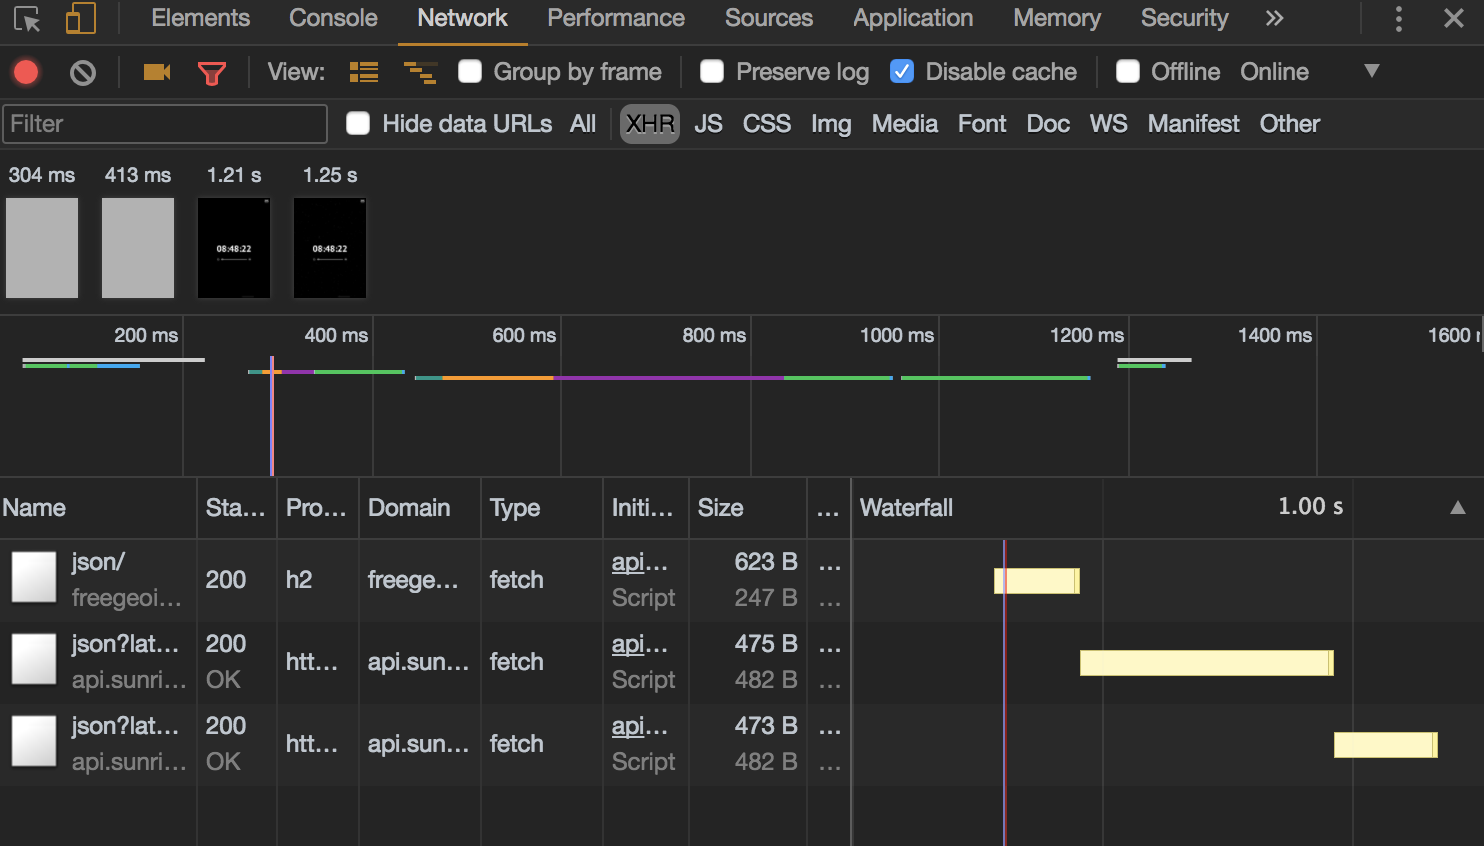
That's really slick! Now we only have to parse through a few requests to find what we're looking for.
3. Inspect & Preview...Voila!
Find the request that you're interested in. Click on the request and you should see a menu like this pop up.
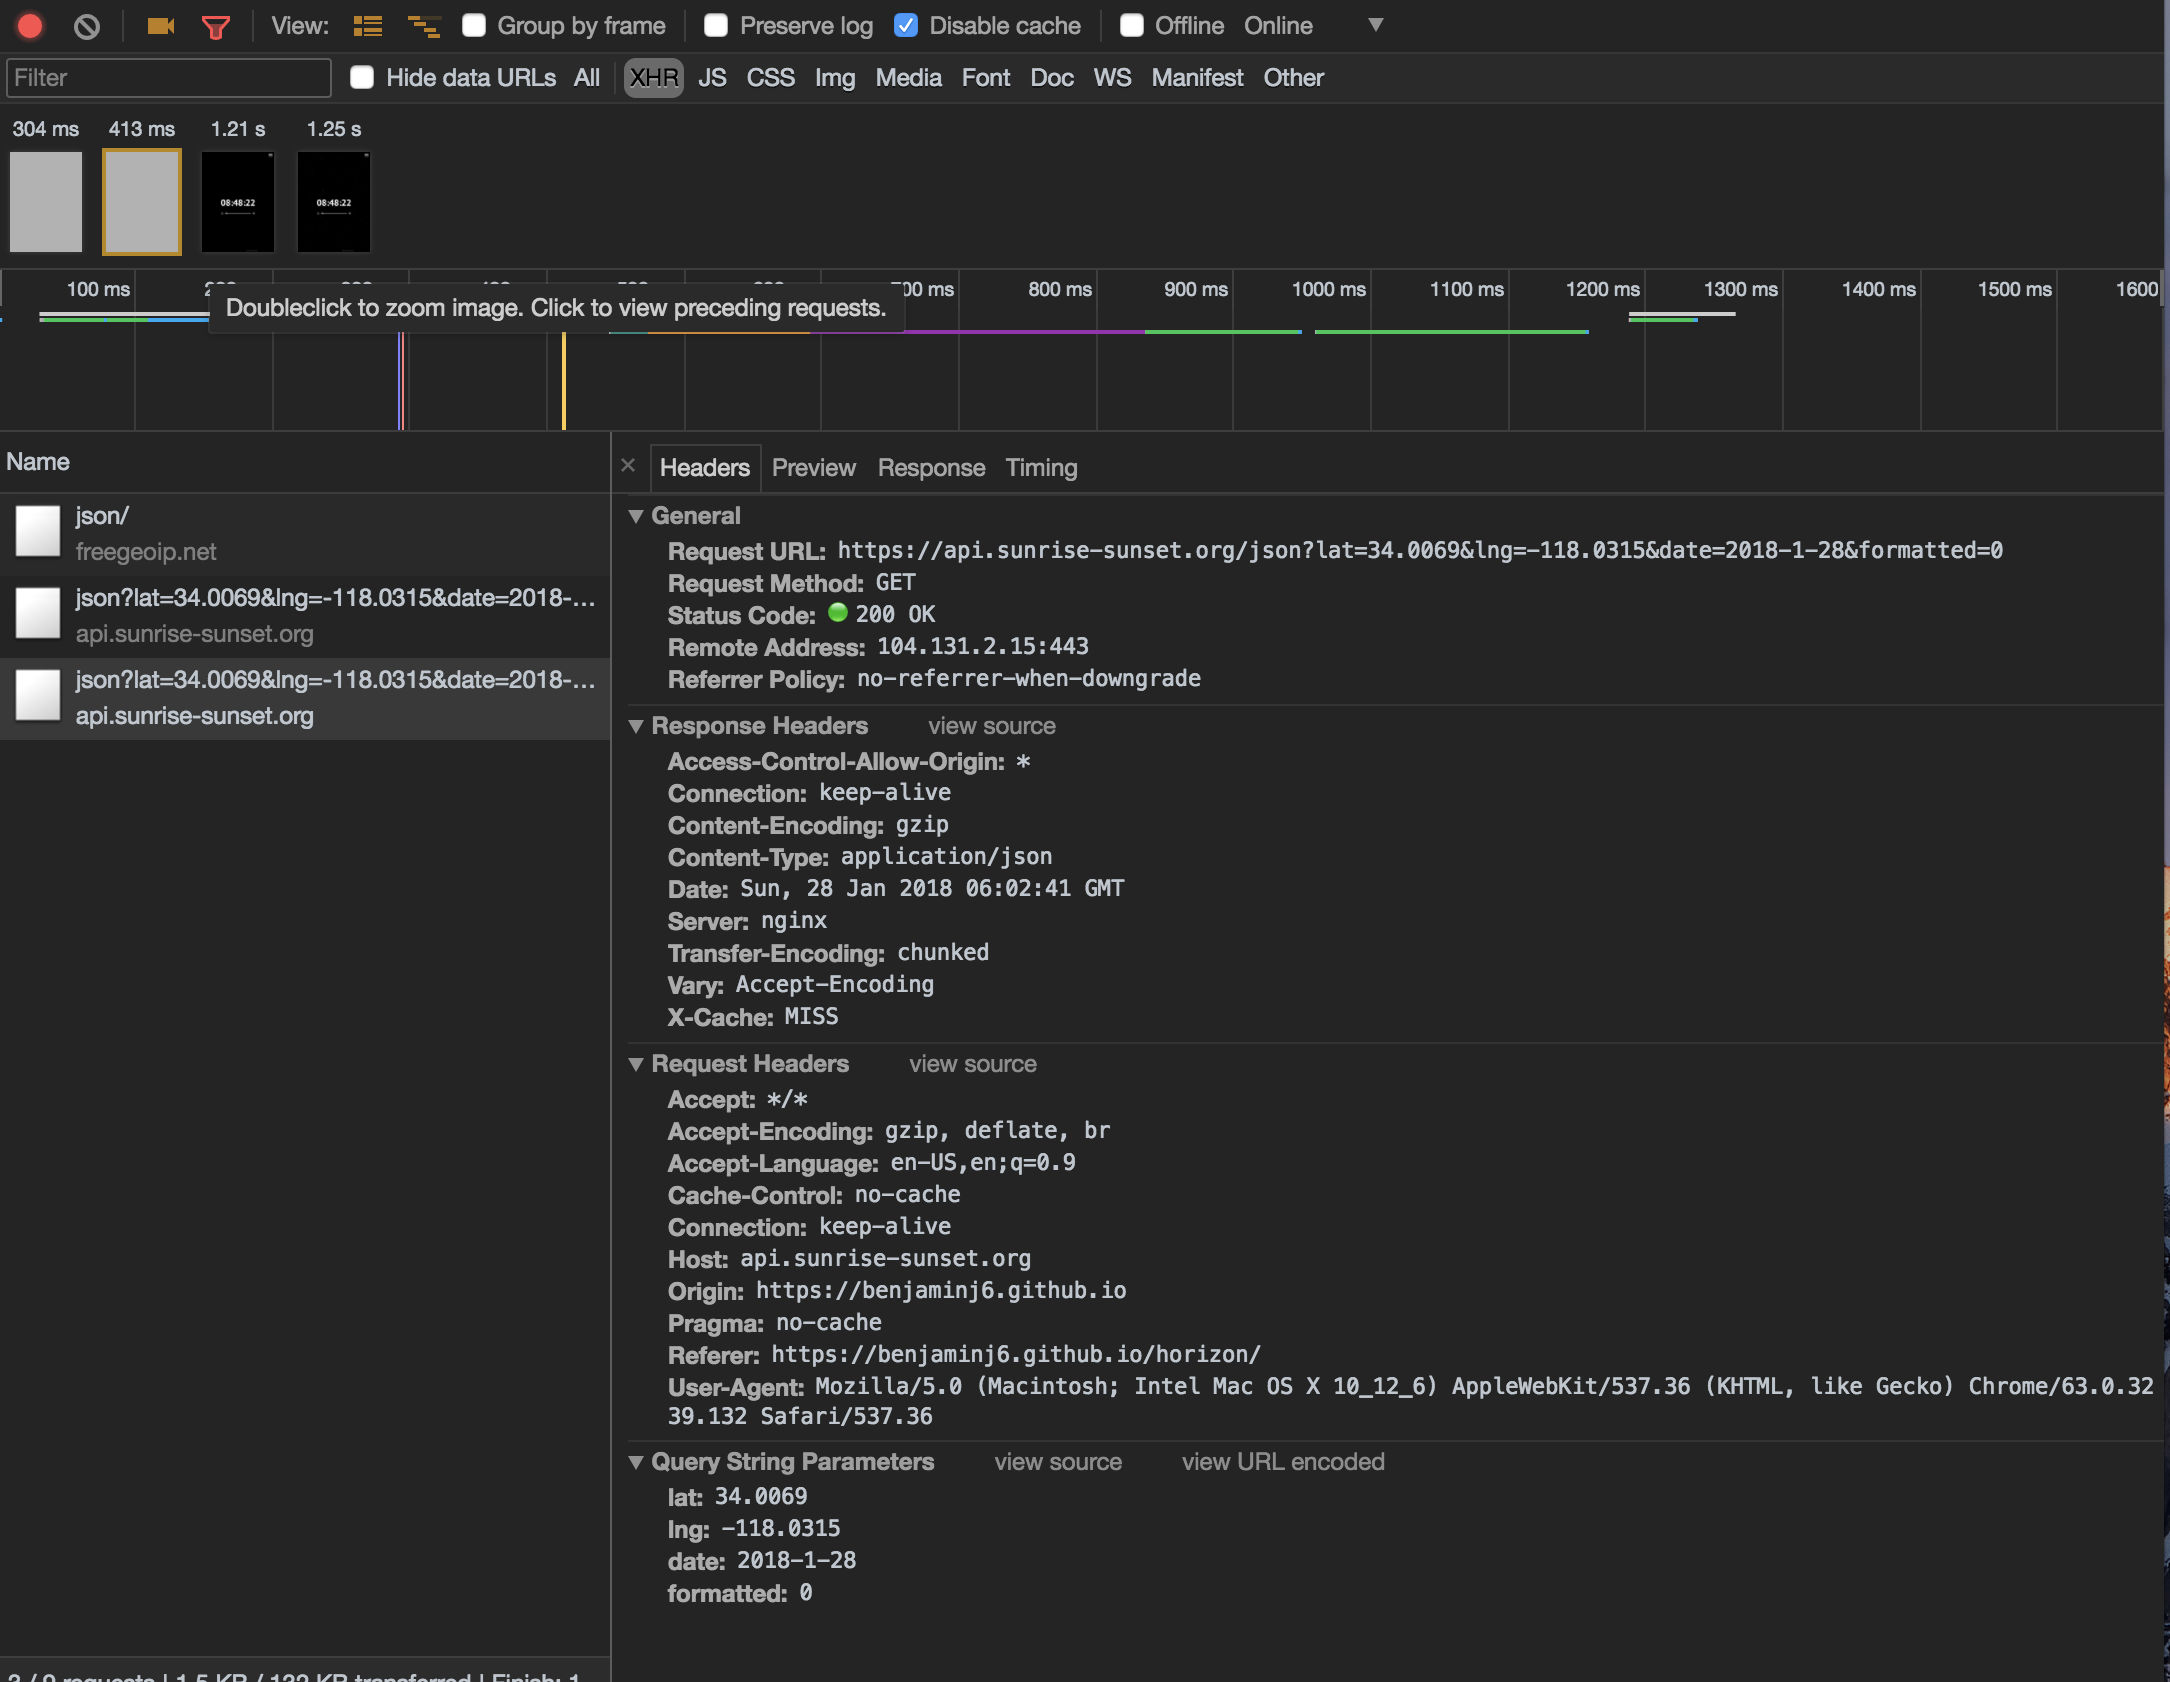
The final step is for us to select that Preview tab. Once selected, you should see something like this.
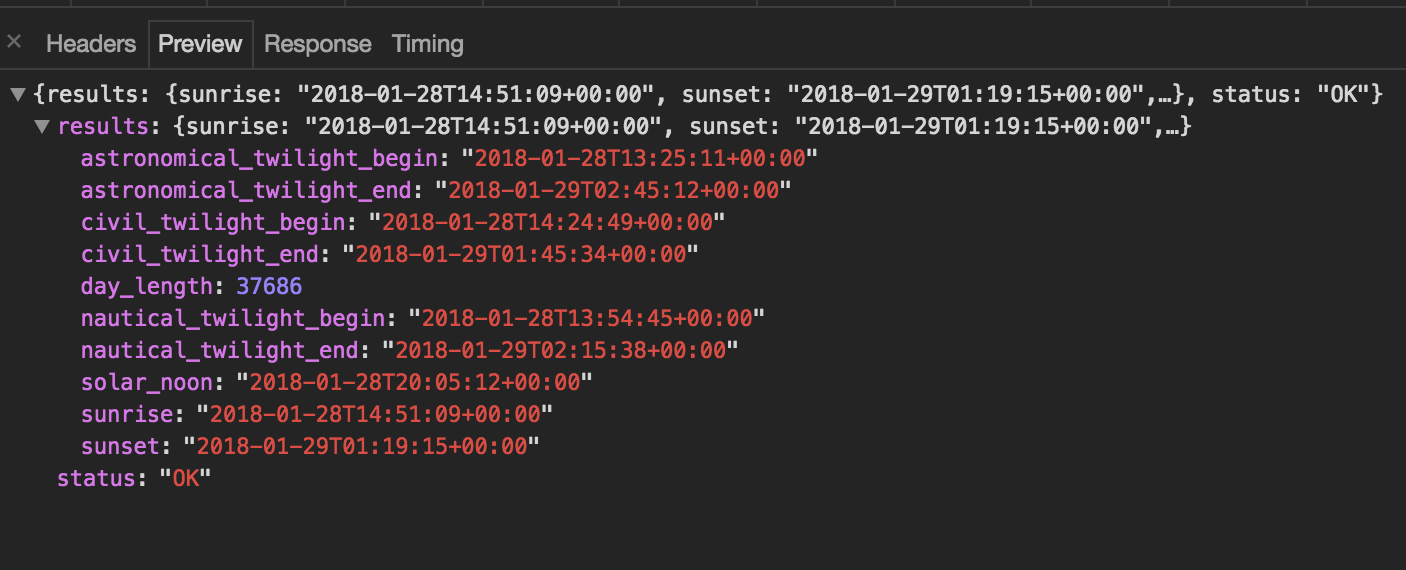
There's our JSON! We've successfully found it without touching our source code. This means we can use this method of debugging anywhere we can use Chrome DevTools — including debugging sites in production with minified JavaScript.
Conclusion
If you’re a seasoned pro and read all the way to the end, you might be thinking, “I’ve known this for years, people have really never learned this?”
When I first discovered this method of debugging network requests, I felt like I had just been given superpowers. I’m grateful for the developers in my career that taught me how to use tools and increase my productivity. A well-placed console.log can be an extremely effective tool, but scattering it all over source code felt much like the whole "Maslow's Hammer" dilemma:
I suppose it is tempting, if the only tool you have is a hammer, to treat everything as if it were a nail.
— Abraham Maslow, 1966
As always, if you read this post and enjoyed it, I'd love to know! Shoot me a tweet on my Twitter or connect with me on LinkedIn.